

Satellite data is being turned into something that has become important to international war reporting… a way to see and measure destruction on the ground.
OSU geography professor Jamon Van Den Hoek and researcher Corey Scher have spent years developing methods to detect damage to buildings and infrastructure using satellite radar. Their methods caught on globally in an important way.
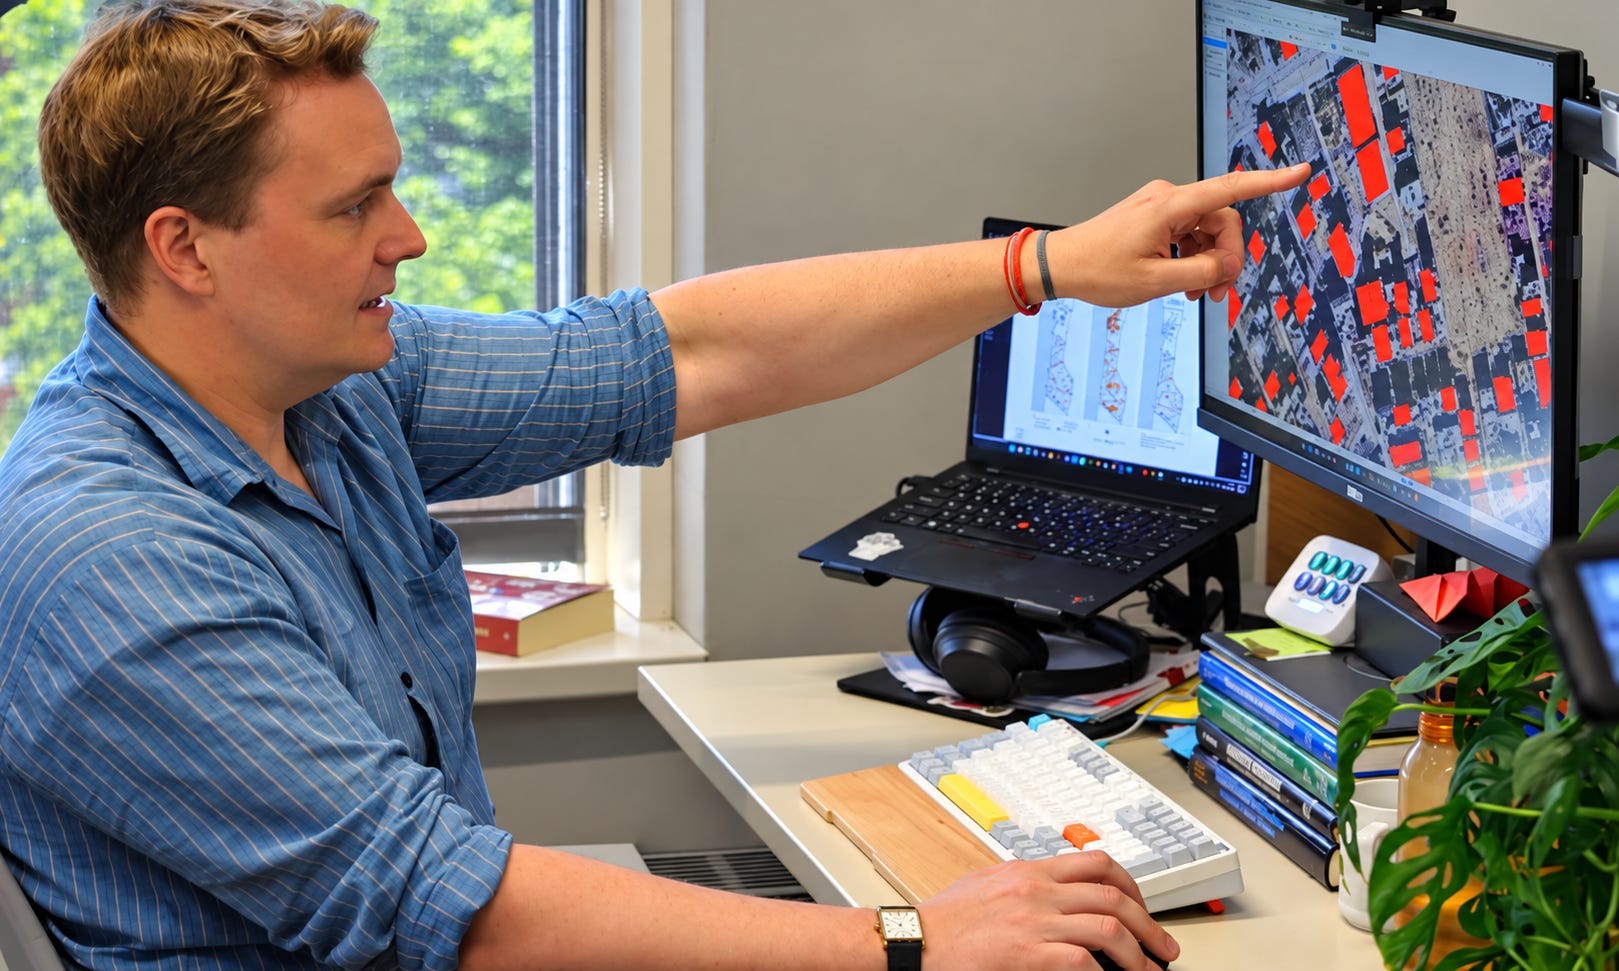
(Photo: Jamon Van Den Hoek/OSU Today)
How important? The researchers’ work, called the “Decentralized Damage Mapping Group,” is used by The Washington Post, NPR, Le Monde, and The New York Times, just to name a few. It has been used to map and document destruction in Gaza.
The lab’s work has received widespread global attention and has helped inform many public analyses of the destruction in Gaza, Sudan, Ukraine, and other areas of conflict.
Their system doesn’t rely on conventional satellite photographs. Van Den Hoek and Scher analyze data from the European Space Agency’s Sentinel-1 radar satellites, looking for changes in the way radar signals interact with buildings and other structures.
“Every five or six days since the war started, we’ve collected satellite radar data and processed them ... to reveal likely damage to structures,” Van Den Hoek told Scientific American during the early months of the Gaza war. “We share those resulting images with journalists and humanitarians.”
In Gaza, where access for outside journalists has been heavily restricted. The Washington Post began using their analysis within days of the October 7, 2023 attack on Israel and the beginning of Israel’s subsequent military campaign.
NPR has also relied on their work. One year after the war started, NPR reported that nearly 60% of buildings in Gaza had been damaged or destroyed, citing satellite analysis by Scher and Van Den Hoek.
Le Monde went further, and worked with the researchers to map a year of destruction across Gaza. Its analysis used their Sentinel-1 work alongside United Nations assessments and high-resolution commercial satellite imagery.
CBS News, Axios, and The New York Times have also incorporated their data into reporting and visualizations.
Van Den Hoek said his team publicly released its first Gaza damage assessment within seven days of the start of the war, and produced weekly updates during the first year.
“We would send updates to a global community of journalists and humanitarians, about 250 people around the world,” Van Den Hoek said in an interview published earlier this year by Middle East Report. “A lot of those maps made their way into media coverage, humanitarian reports, and different high-level UN reporting.”
We looked into that, and United Nations documents confirm that reach. A 2024 UN Conference on Trade and Development, its final report specifically cites damage analysis produced by Scher and Van Den Hoek.
What the satellites have shown surprised even the researchers. “The speed and extent of damage caught us off guard,” Van Den Hoek said of Gaza.
Scher described watching damage spread across northern Gaza in the early months of the war as “almost a metastatic pattern of damage,” with individual clusters growing and new ones appearing over time.
The researchers and their collaborators have used similar techniques to study destruction in Ukraine, Lebanon, Sudan, and other conflict zones, as well as natural disasters.
Their maps have become more than academic research at this point… they are part of the information that global media outlets use, the articles that get published, to help inform you of the scale of destruction.
This article was written by Derek S., a contributor to The Corvallis Inquirer. Feel free to send us your stories or articles to publish at: editor@corvallisnow.com
More recent stories:


→ Donate
We’ll still keep it ad-free and paywall-free even if you don’t. 100% of donations go to expanding local reporting, giving back to community causes, and minor operating expenses. Read more about our values and mission here.

Do you have a story for The Inquirer? Email: editor@corvallisnow.com


